As world events and economic shifts influence the social sector, it can be difficult to get a clear, complete, up-to-date picture of giving behavior. Crises often have substantial but short-lived impacts on giving trends, while analyzing financial donations alone omits valuable contributions of time, talent, influence, or material goods. Behaviors, beliefs, and demographics also play a critical role in guiding and informing individual generosity.
Increasing our understanding of generosity requires looking at all these factors and exploring their impact on philanthropy. That’s why today, we’re thrilled to be launching our first GivingPulse quarterly report. This exploration of the giving ecosystem is a key workstream within our research agenda, capturing dimensions of generosity that expand beyond financial giving including volunteering, informal support, and item donations.
 Click here to check out the full GivingPulse Q3 2023 Report
What is GivingPulse?
In 2022, with the support of the Fidelity Charitable Trustees Initiative, we launched GivingPulse, a national weekly survey of American giving behaviors. This survey is designed to offer the social sector an accurate, up-to-date, evidence-based snapshot reflecting the current state of giving in America at any given time.
While our initial GivingPulse report focuses on giving behaviors in the US, we’re looking for opportunities to expand to other countries in the future.
Our GivingPulse survey tracks every form of individual generous interaction within 7 days of completing the questionnaire. We combine these behaviors with a spectrum of demographic and attitudinal traits to present a complete picture of who is giving (time, treasure, talent, or influence), who they are giving to (nonprofits, informal organizations, or others), and what motivates them to get, and remain, involved.
We also track these factors against world events and national disasters. Our aim here is to determine the influence that evolving global contexts exert on individual choices and patterns. In time, GivingPulse will allow the social sector to explore how various events, interventions, crises, and demographic factors impact or correlate with generosity in near real-time.

“Empowering change-makers and giving them voice across the full giving landscape is critical. That’s why GivingPulse goes beyond just financial donations to capture all types of giving behavior, offering new perspectives and illuminating timely trends in the social sector. With this information, change-makers, nonprofits, and researchers can more effectively engage with shifting giving sentiment and better understand the landscape of generosity in which they reside. Partners across the sector always ask who gives what, and to whom, and with GivingPulse, they’ll now have regular, up-to-date answers that can guide giving strategies.”
– Woodrow Rosenbaum, Chief Data Officer of GivingTuesday
While GivingPulse data was used throughout our 2022 Lookback Report, moving forward we’ll publish dedicated quarterly reports that dive into our survey data and explore shifts in giving behaviors and perspectives. While our first report covers Q3 of 2023, the complete survey data in its current format dates back to September of 2022. This helps us establish which behaviors and traits are stable and which fluctuate.
GivingPulse Q3 2023
In our inaugural GivingPulse report, we’ve analyzed twelve months of survey data spanning from September 2022 to September 2023. Each week during this period, we asked 100 people across the USA what generous actions they undertook in the last 7 days1.
Let’s dig into some of our key findings.
Forms of Generosity
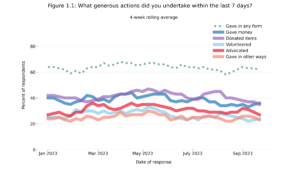
Our survey data shows that giving sentiment remains strong throughout the US, with over 60% of respondents reporting some form of giving in each of our surveys. Donating items and giving money were the most common forms of generosity, and respondents most often gave to formal, registered organizations.
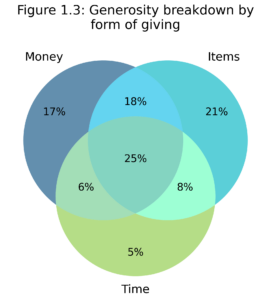
Yet, when we break down reported generosity by form of giving and by recipient type, one thing shines through: people give in many ways. Looking at this Q3 2023 data, givers of all three gift types formed the largest sub-segment of the population (25%), as did those who gave to all three recipient categories (38%).
Critically, nearly 75% of people who reported that they gave money recently also reported giving in at least one other way.
Giving Groups
One of the key approaches found in our Q3 GivingPulse report is clustering respondents into generosity profiles based on their giving participation rates. These “giving groups” help illuminate the specific factors that influence giving attitudes and behaviors over time. And significantly, the proportions of respondents in each of these categories has remained stable (+/- 2%) quarter to quarter.
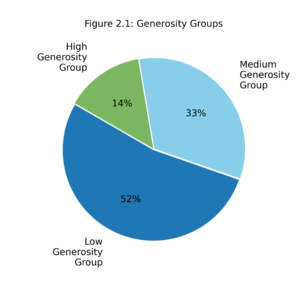
Generally we found that the high generosity group, comprising 14% of those surveyed, prefers to set up automated giving and follows an annual budget or plan that supports formal charity organizations. By contrast, the medium generosity group (33% of respondents) is more spontaneous in their giving, often helping people and organizations unprompted. The final and largest cohort (52% of respondents), the low generosity group, are collectively less active in their giving behavior and don’t favor one giving mode or behavior over another.
- Levels of Engagement: A defining characteristic of the medium generosity group is that they often give without being asked. In each quarter of our survey so far, at least 49% of respondents in the medium generosity group reported recent unsolicited giving. This is especially interesting given that fewer respondents in this group reported being solicited (55%) compared to those in the high generosity group (69%). This is a real opportunity for nonprofits: increasing targeted outreach to medium generosity groups can increase the breadth of donor pools.
- Demographic Differences: Most of the demographic characteristics we tracked did not vary significantly between giving groups. However, we saw clear differences in income, religiosity, and age between the groups. As expected based on other research2, those with higher incomes and those who were highly religious were more present in the high generosity group.
- Attitudes about Giving: The majority of people surveyed felt that everyone has a responsibility to give and help those in need. But folks in the high generosity group were more likely to agree that they sometimes give out of a sense of guilt or peer pressure. Although the influence of these factors diminished in Q3 compared to Q2, they remain defining traits of this generosity profile.
- Attitudes about Nonprofits: Just over half of all respondents (51%) reported that donating money to charities provides too much of a financial strain on them. Interestingly, this feeling is highest among the medium generosity group (62%), although there’s a strong consensus among this group that they enjoy giving to nonprofits (89%), suggesting their enjoyment of giving outweighs their financial concerns.
Top Shifts in Q3 2023
These are the top 5 shifts in behaviors or perspectives we found in Q3 2023 when comparing to previous quarters:
GivingPulse Q3 2023 Top Shifts
- Giving Groups: We found that respondents could be clustered into three “giving groups,” based on their giving behaviors. High generosity givers tend to plan ahead and favor automated donations, while medium generosity donors favor spontaneous acts of giving. By comparison, the low generosity group is less involved.
- Situational Giving: Participation in giving behavior declined in Q3 (by 8%-16%), across both in-person and online giving.
- Financial Strain: Fewer givers in the high generosity group reported feeling financially strained in Q3 (59%) compared to Q2 (73%).
- Guilty Motivation: In Q3, fewer high generosity givers (56%) reported sometimes giving out of a feeling of guilt for “having so much,” compared to Q2 (79%).
- World Events: The Maui, Hawaii wildfire was the top concern for US citizens in Q3, followed by natural disasters in Morocco and Libya.
To read more about generosity profiles as well as the rest of the highlights and trends in our GivingPulse Q3 2023 report, click below:
What’s Next for GivingPulse?
In the first few months of 2024, we’ll release our next GivingPulse report. At that time, we’ll be analyzing survey data from all of 2023, giving a comprehensive picture of how giving trends changed throughout the year. We’ll also be expanding our analysis of how identity and worldview relates to forms of generosity, and diving deeper into what people give and who they give to.
Additionally, we plan to improve our data visualization and analysis tools, available to researchers through our GivingTuesday Data Commons platform. The data already accessible through the platform includes both raw and structured GivingPulse data, along with its schemas and summary tables.
Throughout 2024, we will also work to deploy the GivingPulse model internationally. In the future, we hope to explore and compare survey data from individuals around the world, providing an even clearer picture of the influences and impacts of key metrics on generosity trends.
To find out how to access our GivingPulse data, please click here.
1 These actions could include giving money, time (volunteering), items, or advocating for causes or groups. We also ask people to distinguish whether they gave to a formal registered charity, some informal group, or an individual.
2 Including https://philanthropy.iupui.edu/news-events/news-item/affluent-americans-gave-48-percent-more-on-average-last-year,-finds-2021-bank-of-america-study-of-philanthropy.html?id=370 and https://philanthropy.iupui.edu/news-events/news-item/religiously-affiliated-people-more-likely-to-donate,-whether-to-place-of-worship-or-other-charitable-organizations.html?id=241.